Scatterplots and Their Construction - Questions
🔒 Unlock Full Access
You're currently viewing a preview. Sign up or log in to access all 5 questions and complete solutions.
Question 1
30377
The scatter plot shows the percentage of unemployed adults and the number of major thefts per day. How many thefts occurred when there was 10% unemployment?
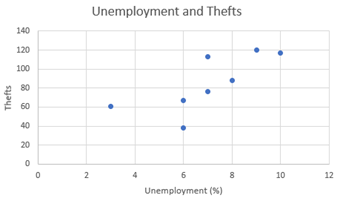
Approx 121
Approx 117
Approx 108
Approx 84
📚 Want More Questions?
There are 4 more questions available. Create your free account to access the complete question set with detailed solutions.