Using Graphs to Describe Change - Questions
🔒 Unlock Full Access
You're currently viewing a preview. Sign up or log in to access all 9 questions and complete solutions.
Question 1
114281
The graph describes the temperature \(T\) change of an object over time \(t\).
Which best describes this graph?
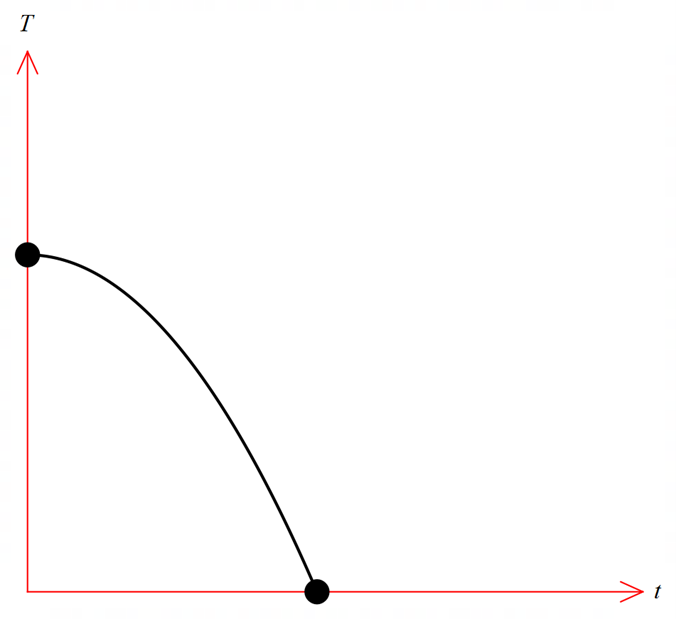
The temperature decreases at a constant rate
The temperature decreases at an increasing rate
The temperature decreases at a decreasing rate
The temperature increases at an increasing rate

📚 Want More Questions?
There are 8 more questions available. Create your free account to access the complete question set with detailed solutions.