Time-Series Data
Unlock all 10 questions & worked solutions
You're viewing a free preview. Create an account to access the complete question set, step-by-step solutions, and progress tracking.
All Questions
Access the full question set for every topic.
Worked Solutions
Step-by-step explanations for every answer.
Track Progress
Mark questions right or wrong and monitor your growth.
It's Free
No credit card required - sign up in under a minute.
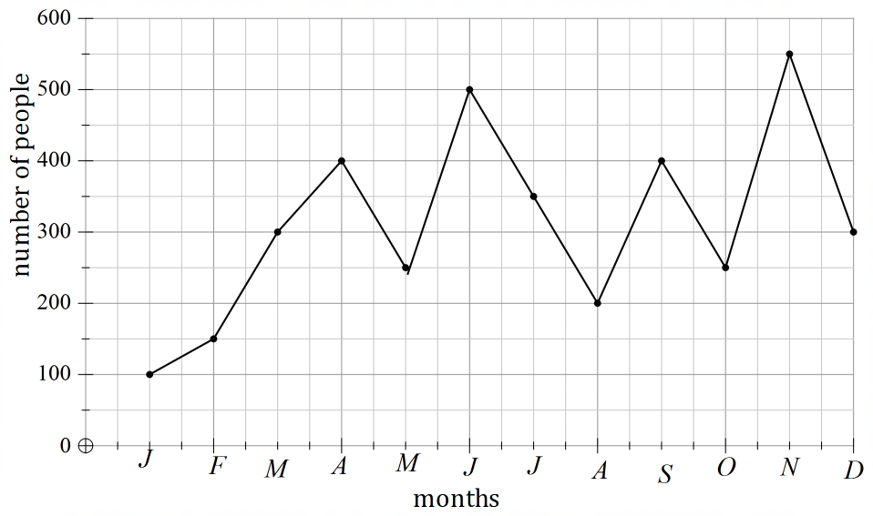
The following is the plot of number of people visiting the East End Mall in the village Bonalbo,NSW in 2011.
a) In which month was the number of people visiting at a maximum?
b) In which month was the number of people visiting at a minimum?
c) What is the difference of number of people visiting in June and August?

📚 Want More Questions?
There are 9 more questions available. Create your free account to access the complete question set with detailed solutions.