Year 8 Maths
Investigating Data
Frequency Histogram and Polygons
ACCOUNT REQUIRED
Unlock all 4 questions & worked solutions
You're viewing a free preview. Create an account to access the complete question set, step-by-step solutions, and progress tracking.
All Questions
Access the full question set for every topic.
Worked Solutions
Step-by-step explanations for every answer.
Track Progress
Mark questions right or wrong and monitor your growth.
It's Free
No credit card required - sign up in under a minute.
Questions
Question 1
33104
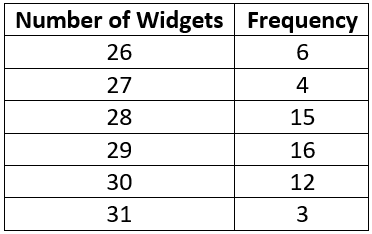
A packet of widgets is labelled contents \('30'\) but a quality control check found the results in the adjacent table.
\begin{array}{|c|c|}\hline \text { Number of Widgets } & \text { Frequency } \\
\hline 26 & 6 \\
\hline 27 & 4 \\
\hline 28 & 15 \\
\hline 29 & 16 \\
\hline 30 & 12 \\
\hline 31 & 3 \\
\hline
\end{array}
a) Using the graph, draw a frequency histogram from the data provided.
b) Determine the range.

📚 Want More Questions?
There are 3 more questions available. Create your free account to access the complete question set with detailed solutions.